CH07. Validating Business Feasibility and the Effective Market
Questions This Chapter Answers
- How is business feasibility different from simply finding a large market?
- Why must the total market (industry size) be distinguished from the market I can actually capture?
- Why aren’t market boundaries fixed, and what changes depending on who we define as the “buyer”?
- How does the Business Model Canvas (BMC) move from a qualitative idea to a quantitative revenue and cost estimate?
- In what order do the 9 steps of Effective Market estimation proceed, and why don’t they finish in a single pass?
- What does QCD (Quality, Cost, Delivery) examine, and why must all three factors be reviewed together?
- Projected P&L and the Effective Market both use the same P×Qty formula, so why do they answer different questions?
- Why does the basis for Qty differ across B2C, B2B, and B2G?
- What does it mean, in practice, to treat the outcome of Effective Market estimation not as a single fixed answer but as something to be validated repeatedly?
Learning Objectives
By the end of this chapter, learners will be able to:
- Explain that business feasibility is not a calculation that arbitrarily converts “a certain percentage of the total market” into revenue, but a process of testing a designed business logic against real-world resource and cost constraints.
- Distinguish the total market from the Effective Market, and explain why the Top-down and Bottom-up perspectives must be used together.
- Distinguish the User from the Buyer (Customer), and explain why market boundaries and data differ across B2C, B2B, and B2G.
- Explain the turning point (the cost-input review) that connects the qualitative elements of the BMC to revenue and cost estimation.
- Explain the flow of the 9-step Effective Market estimation process (hypothesis building → QCD review → final model confirmation → Effective Market calculation) and the iterative nature of each stage.
- Explain why the three elements of QCD must be reviewed simultaneously, and judge where to return if even one is not satisfied.
- Distinguish between Projected P&L (current feasibility, close to SOM) and the Effective Market (expandability, close to SAM).
- Explain, through B2C, B2B, and B2G cases, how the basis for Qty differs by transaction type.
- Apply the understanding that Effective Market estimation is not a forecast of the future but a logical proof, one that must be recalculated whenever assumptions change.
1. Core Concepts
The most common way of explaining business feasibility is to lead with a large market figure: the total market is 100 billion won, and capturing even 1% of it yields 10 billion won in revenue. But this calculation leaves out why we could capture that 1% in the first place — which customers buy for what reasons, through what price and channel the revenue is generated, and how much cost and resources are needed to generate that revenue. Business feasibility is not a matter of importing numbers from a market research report; it is the process of testing the logic of a designed business against real-world constraints and figures. Even if a market looks attractive, if you cannot reach the customer, if margins turn negative the more you sell because of cost and channel expenses, or if you cannot secure the production or delivery capability required, that market is not yet the market for your business.
Writing a business plan document and building a business plan are different tasks. A business plan document is the assembled output of the backing data accumulated while validating an item; building a business plan is the process of validating an idea, constructing a business model, and connecting execution strategy to projected financials. Listing TAM, SAM, and SOM before the skeleton of the business model and revenue model have been made concrete has little practical value, and a calculation of the form “we just need to capture a few percent of this huge market” is closer to wishful thinking than to analysis. The Effective Market is not the work of slicing a big number into a smaller one; it is the work of calculating the realistic territory that remains after passing through the constraints of the business model. This validation does not redesign the price, cost, and revenue model established in CH06 — it confirms whether the business holds up once those input values meet actual sales quantity and resource/cost conditions.
This confirmation work starts from two distinctions. The first is the distinction between the total market and my market. Market trend data is needed to understand whether an industry is growing, what technology and consumption trends are emerging, and how the competitive landscape is shifting. But the size of the entire industry and the market I can actually capture are different numbers. For a resource-constrained startup, a larger total market size does not necessarily mean a better business. What matters is identifying where, within that large market, lies the portion reachable with the technology, resources, channels, and cost structure you actually have. This is why you need to look at the market using both a Top-down perspective, working down from the industry, and a Bottom-up perspective, working up from the customer’s actual purchasing potential. The total market is the starting point for understanding the external environment and opportunity; the Effective Market is the result of the choices made about product, customer, price, channel, and resources. Market size, therefore, should not be treated as a figure you enter once at the start of business planning — it is a variable that changes together every time the business model is revised.
The second distinction is a buyer-defined market. The fundamental reason market size is difficult to estimate is that the boundary of the market itself is not fixed. If you define the market as the set of actual and potential buyers, the focus must be on the Buyer who pays the cost, not on the User. Even for the same product, who pays determines the unit and the data of the market. Selling directly to consumers makes the buyer an individual; supplying a distributor or manufacturer makes the buyer a company; and in the public procurement market, a government agency or local authority becomes the buyer. Even for the same technology and product, when the transaction relationship shifts across B2C, B2B, and B2G, the number of customers, purchase volume, pricing structure, channels, and decision-making conditions that make up the market inevitably all change. Before calculating the Effective Market, you must first distinguish “who is the User, who is the Buyer, and who approves the budget.” Skip this question, and the very data chosen to calculate market size can be the wrong data. Effective Market estimation is, before it is a technique for calculating market size, a process in which the entrepreneur strategically defines the market’s boundary.
2. Key Frameworks and Mental Models
Once you have distinguished the total market from your market, and the User from the Buyer, the next task is to move this distinction from a qualitative idea to a quantitative figure. The Business Model Canvas (BMC) is useful for connecting, at a glance, elements such as customers, value proposition, channels, customer relationships, key resources, key activities, partnerships, cost structure, and revenue streams. But simply writing customers and value proposition on sticky notes makes it hard to judge whether the business actually holds up. In an actual business, you must be able to explain how much revenue is generated when a certain quantity is sold at a certain price, and how much remains after subtracting the cost of generating that revenue. If you reinterpret the BMC so that it connects to a Projected P&L, you can estimate revenue once price and quantity are organized, and you can estimate the cost invested in the business through key activities and cost structure. The critical turning point in this transition is the cost-input review stage. The earlier stages are, relatively speaking, the segment where qualitative concepts and scenarios are built; the later stages are where quantitative review carries greater weight. If the calculated cost turns out to be unaffordable, you must go back and change the customer, product spec, price, or channel chosen earlier. Numbers are not something written down at the end as a result — they play a feedback role that revises the strategy of the earlier stages.
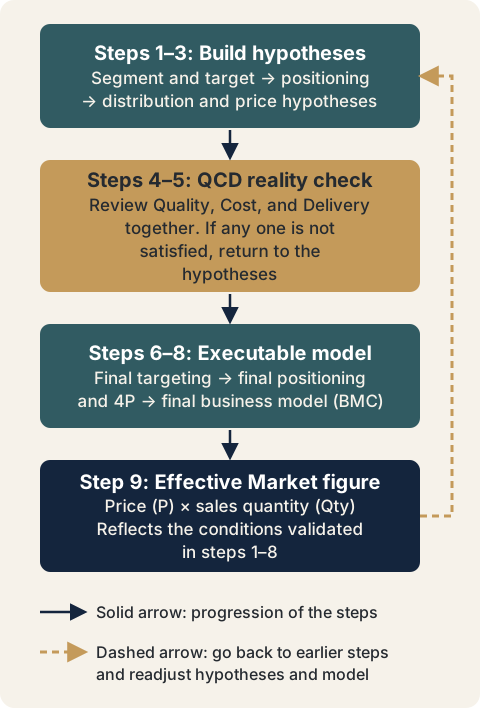
The concrete procedure through which this qualitative-to-quantitative transition actually happens is the 9-step Effective Market estimation process. The purpose of the 9 steps is not to fill in every item on a checklist. It is to take an idea and a market hypothesis, pass them through the real-world filter of resources and cost, revise the customer, price, and business model accordingly, and ultimately express the result as a figure called the Effective Market. The 9 steps fall broadly into four segments.
Steps 1–3: Build the hypothesis. Starting from the idea and environmental analysis, divide the overall market into segments and select the target segment. Then set the positioning aimed at that target customer, and build hypotheses for the distribution and pricing that will implement it. At this stage nothing is yet a confirmed business model — it is all a hypothesis to be validated.
Steps 4–5: Confirm reality with QCD. This segment corresponds to Step 4 (available-resource review) and Step 5 (cost-input review), and confirms whether the hypothesis built earlier is executable given actual resource and cost conditions. Looking at QCD together means simultaneously asking whether you can produce the required Quality, whether you can produce it at an affordable Cost, and whether you can Deliver it at the scale and timing the market wants. Quality asks whether you can actually produce a product or service at the level the target customer demands, and Delivery asks whether you can supply it at the scale and timing the market wants. If these two are not satisfied, then no matter how attractive the positioning and price hypothesis, they will not hold up at the execution stage. Cost asks, on the premise that Quality and Delivery are achievable, whether you can produce them at an affordable cost. If the calculated cost results in a structure where you lose money the more you sell, the business does not hold up as a business even if the quality and delivery conditions are met. Looking at QCD simultaneously means that the three elements are not passed through one at a time in sequence — if even one is not satisfied, the entire hypothesis must be reviewed again. If quality is achievable but the cost does not work out, or the cost works out but you cannot deliver at the desired timing, the hypothesis is not yet an executable model, and you must go back and readjust the hypotheses for targeting, positioning, distribution, and price.
Steps 6–8: Narrow down to an executable model. Reflecting the results of the QCD review, confirm the final targeting, settle the final positioning and the 4Ps (Product, Price, Place, Promotion), and, based on that, determine the final business model (BMC). The output of this stage is not a hypothesis but a business model whose executability has been validated.
Step 9: Finally, express the market as a number. Based on the confirmed business model, estimate the size of the Effective Market. This figure is not a certain percentage of the total market — it is the result reflecting the customer, price, channel, and resource conditions validated through Steps 1–8. If the size derived in Step 9 falls short of the business goal or does not fit the resource conditions, go back to earlier steps and readjust the hypotheses and the model.
The 9 Steps at a Glance
3. Application Process
The number that emerges at the end of the 9 steps is expressed by the formula price (P) × quantity sold (Qty), but applying this number in practice requires two distinctions to be made together.
First, the distinction between Projected P&L and the Effective Market. Startups often need to explain their future plans rather than financial performance already achieved. The reason the term “projected financials” is used instead of simply “financials” is that startups lack sufficient track record. The revenue in the Projected P&L and the size of the Effective Market can both be expressed as price × quantity sold, but they answer different questions. The Projected P&L is closer to “how much can actually be sold with resources currently secured, or securable within a set period,” and it is strongly constrained by resources immediately available, such as production capacity, personnel, channels, and marketing budget. The Effective Market, on the other hand, includes even the portion that cannot be immediately captured today due to a current resource shortfall, so long as it is reachable with the current product and business model once additional resources are secured. The market that can be immediately converted to revenue with current resources — the portion close to the Projected P&L — can be understood as close to SOM, while the market logically reachable once more resources are secured, through investment or otherwise — the Effective Market — can be explained as SAM. The Projected P&L asks “can we survive with this plan right now,” while the Effective Market asks “how far can this business model expand once it secures more resources.” Mixing the two numbers together blurs the line between a realistic revenue plan and growth potential.
Second, the distinction in the basis for calculating Qty by transaction type. The form P×Qty is simple, but the way P and Qty are determined differs by transaction relationship. What matters in Effective Market estimation, then, is not applying a single formula uniformly to every business, but first determining who is buying and what data explains demand. In B2C, since the individual consumer is the buyer, “at what price, how many people, and how often will they buy” becomes the core logic explaining Qty. In B2B, price and quantity are not independent of each other — they move together depending on order scale and production method, and a Top-down approach that uses the production performance of the upstream industry may be used rather than directly multiplying by a number of consumers. In B2G, the buying entity is a public institution, and procurement scale is affected by government budget and legal obligations. Even if you calculate a value by multiplying equipment price by the number of potential installation sites, that figure cannot exceed the budget range actually executable in the public market. Qty in B2G is not simply a count of institutions — it depends on whether there is a legal obligation for installation or management, which budget line item the spending comes from, how large that budget is, and whether the approach to the public institution is through direct sales or a partner channel. In the public market, institutions and budgets become an additional constraint that governs market size.
The Effective Market size calculated this way is not a fixed number once the calculation is done. Calculating the Effective Market size does not mean you can predict actual future revenue. The market, the competitive environment, customer behavior, cost, and resources keep changing. What matters in this framework, therefore, is not only the precision of the calculated number, but whether it can be explained what assumptions and decisions the number went through to arrive where it is. Effective Market estimation is not “a prophecy that predicts the future” but closer to a logical proof that the business model can work through real-world constraints. The 9-step process does not finish in a straight line — it becomes more refined as it loops back to earlier steps depending on the cost and resource situation. So rather than fixing a single number as “the answer,” recalculating the Effective Market whenever assumptions about customer, price, channel, resources, or cost change is closer to how this methodology is actually meant to be used.
4. Common Judgment Errors
- Arbitrarily converting a percentage of the total market into revenue: A calculation like “the market is 100 billion won, so even 1% is 10 billion won” is closer to wishful thinking, with no answer to who buys, why, and at what price and channel.
- Listing TAM, SAM, and SOM before the business model and revenue model are made concrete: Filling in market-segmentation terminology before the skeleton of the business model exists has little practical value.
- Bringing the total market size over as-is to be your market: Failing to distinguish the total potential industry-wide revenue reported in a technology-trend report from the market of the product you can actually make and sell leads to “mistaking the total market for your market.”
- Not distinguishing the User from the Buyer: Confusing who uses the product with who pays for it means the very data used to calculate market size is the wrong data.
- Leaving the BMC at the sticky-note stage: Stopping at qualitatively organizing customers and value proposition, without connecting them to price × quantity and cost, makes it impossible to confirm whether the business actually holds up.
- Passing QCD through one element at a time, in sequence: Checking quality alone without looking at cost or deliverability, or failing to go back to an earlier stage when even one of the three elements is not satisfied, means pushing forward with a hypothesis that is not executable.
- Mixing Projected P&L with the Effective Market: Failing to distinguish revenue executable with current resources (SOM) from the potential market reachable once more resources are secured (SAM) blurs the line between a realistic revenue plan and growth potential.
- Applying the same Qty calculation method to every transaction type: Applying B2C’s “number of consumers × purchase frequency” approach directly to B2B or B2G causes you to miss constraints such as the linkage between order scale and production method, or budget and legal obligations.
- Treating the result of Effective Market estimation as a fixed answer calculated once: If the number is not recalculated when assumptions change, Effective Market estimation ends up as a formal report figure rather than a logical proof.
5. Practical Application Questions
- Is the market size I’m about to present “a certain percentage of the total market,” or is it an Effective Market derived through customer, price, channel, and resource conditions?
- Given the technology, resources, channels, and cost structure I can access, which part of the total market can I actually capture?
- In this business, are the User and the Buyer (Customer) the same, or different? Who approves the budget?
- Does this business fall under B2C, B2B, or B2G, and what data will I use to explain the basis for Qty accordingly?
- Is my BMC concrete enough to explain the revenue and cost when a specific quantity is sold at a specific price?
- Does the hypothesis I’ve built satisfy all three conditions of Quality, Cost, and Delivery? Which element is not satisfied, and which hypothesis do I need to go back and adjust?
- What figures am I placing on my Projected P&L (current feasibility, close to SOM) and my Effective Market (expandability, close to SAM), respectively, and can I explain the distinction between them?
- What assumptions underlie the Effective Market size I’ve just calculated? Which of those assumptions is most likely to change first?
- If the result of the Effective Market estimation does not match the target profit (CH01) or the target cost/price structure (CH06), which of the 9 steps should I go back to?
6. Connection to the Next Chapter
The Effective Market size derived in this chapter is not a number fixed as the final answer — it is the starting point for the next round of validation. Effective Market estimation is not a forecast of the future but work that proves the consistent application of assumptions and logic at the current point in time, and the 9 steps are not a sequence that ends once you pass through it — they form a non-linear validation process in which real-world constraints discovered at a later step loop back to an earlier step and readjust the assumptions. This repeated validation carries forward, using the result of Effective Market estimation as the starting point for the next round of validation, continuing to identify assumptions that have not yet been confirmed. The next chapter deals with putting this logically proven Effective Market and business model into actual execution, validating the assumptions through the results of that execution, and pivoting where necessary.
Key Takeaways
- Business feasibility is not a calculation that converts a percentage of the total market into revenue — it is the process of testing the designed business logic against the realistic constraints of resources and cost.
- The total market and the Effective Market are different numbers, and the Top-down (from industry downward) and Bottom-up (from customer upward) perspectives must be used together.
- Market boundaries are not fixed, and the focus should be on the Buyer, not the User. The number of customers, purchase volume, pricing structure, channels, and decision-making conditions all differ across B2C, B2B, and B2G.
- The BMC must not stay at the sticky-note stage — using the cost-input review as the turning point, it must connect to revenue and cost estimation based on price × quantity.
- The 9-step Effective Market estimation process flows as hypothesis building (1–3) → QCD review (4–5) → final model confirmation (6–8) → Effective Market calculation (9), and it is an iterative structure in which results from later steps loop back to earlier steps.
- QCD (Quality, Cost, Delivery) is not a checklist passed through in sequence but a condition that must be satisfied simultaneously — if even one is off, you must go back to the hypothesis.
- Projected P&L (current feasibility, close to SOM) and the Effective Market (expandability, close to SAM) use the same P×Qty formula but answer different questions, so they must not be used interchangeably.
- Effective Market estimation is closer to a logical proof than a prophecy predicting the future, and it must be recalculated whenever assumptions change.
Source Map
- MN: MN07 Business Feasibility, Effective Market, and Projected Financials
- KM: KM055–KM063 (listed by file)
- KM055-business-feasibility-meaning.md — The meaning of business feasibility
- KM056-total-market-vs-addressable-market.md — Total market vs. my market
- KM057-buyer-defined-market.md — Buyer-defined market definition
- KM058-qualitative-to-quantitative-bm.md — Converting a qualitative BM into quantitative terms
- KM059-effective-market-9-steps.md — The 9-step Effective Market estimation process
- KM060-qcd-feasibility.md — QCD and executability
- KM061-estimated-pl-vs-effective-market.md — The difference between Projected P&L and the Effective Market
- KM062-p-times-qty-by-transaction-type.md — P×Qty and Qty by transaction type
- KM063-iterative-validation-of-effective-market.md — Iterative validation of the Effective Market